有些插值應用的場合,我們會很重視整個插值曲線通過表列點時的圓滑性,甚至,基於被描述之現象的本質,我們會希望連其導數(即斜率)函數也是處處圓滑。
例如,如果描述的現象是軌跡(也就是位置對時間的作圖),其導數(當然就是速度函數)在不同的時刻上,仍應是平滑的。速度隨時間的變化如果有尖銳的折點,代表速度在瞬間改變,未必符合我們所要描述之現象體系內應有的條件。在這種狀況之下我們會希望速度仍然圓滑,至於它的下一階導數加速度是連續的就可以了(可以有折線)。
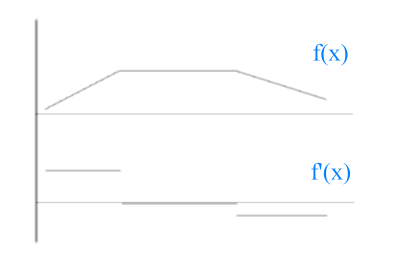
如果我們只使用了線性插值,則圖線像下面的 f(x) ,其一階導數則是 f'(x),從這個例子我們注意到,插值函數的一階導數在表列點上會沒有定義
針對有些插值的應用,我們會希望它跨過表列點時非常圓滑(兩點之間的部分本來就沒有問題),一階導數也是,至於二階導數則在跨表列點時是線性插值(如此至少保證連續)就可以了。在這種場合下,三次板條線 (Cubic Spline) 可以滿足我們的需求。

維基百科上關於 spline 的條目:http://en.wikipedia.org/wiki/Spline_(mathematics)
Cubic Spline 的特性,(1) 形式上是線性插值的延伸與進化、(2) 最高次數為三次,曲線不會過度轉彎、(3) 處處圓滑,跨過表列點時也一樣。
要怎麼讓二階導數滿足線性插值?我們重頭到尾都只有表列點與表列值對 (xi, yi) 呀。 沒關係,我們先寫下含 y'' 的表列值
| x1 |
y1 |
|
y''1 |
| x2 |
y2 |
|
y''2 |
| x3 |
y3 |
|
y''3 |
| : |
: |
|
: |
| : |
: |
|
: |
| xN |
yN |
|
y''N |
我們預期插值函數的二階導數函數 y''(x) 乃由各表列值的二階導數值所線性內插構成:
y''(x) = y''i (x-xi+1) / (xi-xi+1) + y''i+1 (x - xi) / (xi+1 - xi)
現在重要的是,怎麼樣的插值函數 y(x) 能滿足原表列點代入得表列值之條件,並且它在對 x 微分兩次之後會正確得出上面的二階導數函數?
我們從推廣線性插值出發,
y = Ayj + Byj+1
其中 A ≡ ( x -
xj+1 ) / ( xj - xj+1 ) ,B ≡ 1 - A = ( x - xj ) / (
xj+1 - xj ),就是 Lagrange polynomnial 的形式。
而我們現在希望加上一些高階項,讓函數的線條變得更圓滑,但這樣做的同時,又希望保留原本己經在線性插值式中滿足之表列點代入會得表列值的特性,我們因此要求後面加入的東西至少在表列點處其值要為零。
因此,所插值的項
y = Ayj + Byj+1 + Cy''j + Dy''j+1
這裏 A 與 B 定義同上,而多出之部分的兩個新項中,
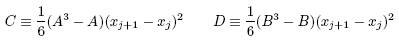
裏面用了 A3 - A = A(A+1)(A-1) 這樣的形式的項,的確可以保證 C 在 x = xi 及 x = xj 都會等於零,D 的作法也相同。
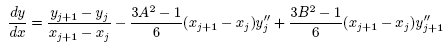
這樣定義下的 y(x),對 x 微分一次會得(待會後面還會用到):
再微分一次,果真得到其二階導數函數恰呈線性插值的形式,如下:
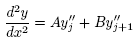
好了,我們透過上列 A、B、C、D 的定義,有了可以用的插值公式,但是這個公式還不能用,理由是公式中的 y''i 我們並不知道。現在,要用以下的策略把它們定出來:
我們看上上一個式子,即 cubic spline 函數的一階導數,它的使用範圍是點 xj 與點 xj+1 之間。xj+1 是這個區間的右端點,自然有在其描述的範圍之內,然而 xj+1 同時也是 xj+1 到 xj+2 的另一條曲線段的左端點,有它自已不一樣的斜率函數公式,為了確保一階導數的圓滑度,我們可以要求在 xj+1 這個點上兩邊的斜率函數值要一樣。 這個條件用下去所寫出來的一條新的等式,把所有未知的 y''i 通通移到等號左邊,則整理得以下的形式。注意所未知數形成一個線性代數方程式:

我們因此可以透過數值方法求解。一旦解出各 y''i ,則 cubic spline 插值公式的建立就確定並完成了。
最後兩個技術上的小細節:
(一)"跨過表列點之斜率要連續" 的條件只有 N-2 個(x1 及 xN 兩點沒有用上這個條件),我們需要另外獨立之兩條未知數 y''i 之間的線性關係式來作為條件,才能解出未知數。這並不難,使用者可以自行指定 y''1 與 y''N 的值,若兩個都選為零就是所謂的 Nantural Cubic Spline。或者,我們也可以指定兩邊端點 x1 及 xN 上的斜率為某特定值 y'1 及 y'N,這是利用上上上式斜率與 y''j 的間關係(即課本 (3.3.5) 式)。
(二)上面的線性代數方程式事實上是一個簡化的特殊形式,寫成矩陣式會看到只有對角線與其近鄰的上下兩條元素不是零,其他都是。這種矩陣叫三對角矩陣 (tri-diagonal matrix),有專用的快速演算法可以解出,其程式相當簡單,已包含在 spline 的副程式中。
本節的副程式要 spline 及 splint 配合使用。
SUBROUTINE spline(x,y,n,yp1,ypn,y2)
INTEGER n,NMAX
REAL yp1,ypn,x(n),y(n),y2(n)
PARAMETER (NMAX=500)
Given arrays x(1:n) and y(1:n) containing a tabulated function, i.e., yi = f(xi), with
x1 < x2 < .. . < xN, and given values yp1 and ypn for the first derivative of the interpolating
function at points 1 and n, respectively, this routine returns an array y2(1:n) of
length n which contains the second derivatives of the interpolating function at the tabulated
points xi. If yp1 and/or ypn are equal to 1 × 1030 or larger, the routine is signaled to set
the corresponding boundary condition for a natural spline, with zero second derivative on
that boundary.
Parameter: NMAX is the largest anticipated value of n.
INTEGER i,k
REAL p,qn,sig,un,u(NMAX)
spline 只需要被呼叫一次,它會把公式所需的二階導數解出來,要插值時就要呼叫 splint (代表 spline interpolation),傳入表列點、表列值、二階導數,以及插值點 x,結果值由 y 傳出。 給定 x,要找尋其在表列點那一個區間的機制已內建在 splint 副程式中,但用的是 bisection 二分法。
SUBROUTINE splint(xa,ya,y2a,n,x,y)
INTEGER n
REAL x,y,xa(n),y2a(n),ya(n)
Given the arrays xa(1:n) and ya(1:n) of length n, which tabulate a function (with the
xai’s in order), and given the array y2a(1:n), which is the output from spline above,
and given a value of x, this routine returns a cubic-spline interpolated value y.
INTEGER k,khi,klo
REAL a,b,h
An Interactive Introduction to Splines
維基百科:http://en.wikipedia.org/wiki/Spline_(mathematics)(Spline 這個字的由來)
Before computers were used, numerical calculations were done by hand. Although piecewise-defined functions like the signum function or step function were used, polynomials were generally preferred because they were easier to work with. Through the advent of computers splines have gained importance. They were first used as a replacement for polynomials in interpolation, then as a tool to construct smooth and flexible shapes in computer graphics.
It is commonly accepted that the first mathematical reference to splines is the 1946 paper by Schoenberg, which is probably the first place that the word "spline" is used in connection with smooth, piecewise polynomial approximation. However, the ideas have their roots in the aircraft and ship-building industries. In the foreword to (Bartels et al., 1987), Robin Forrest describes "lofting," a technique used in the British aircraft industry during World War II to construct templates for airplanes by passing thin wooden strips (called "splines") through points laid out on the floor of a large design loft, a technique borrowed from ship-hull design. For years the practice of ship design had employed models to design in the small. The successful design was then plotted on graph paper and the key points of the plot were re-plotted on larger graph paper to full size. The thin wooden strips provided an interpolation of the key points into smooth curves. The strips would be held in place at discrete points (called "ducks" by Forrest; Schoenberg used "dogs" or "rats") and between these points would assume shapes of minimum strain energy. According to Forrest, one possible impetus for a mathematical model for this process was the potential loss of the critical design components for an entire aircraft should the loft be hit by an enemy bomb. This gave rise to "conic lofting," which used conic sections to model the position of the curve between the ducks. Conic lofting was replaced by what we would call splines in the early 1960's based on work by J. C. Ferguson at Boeing and (somewhat later) by M.A. Sabin at British Aircraft Corporation.
The word "spline" was originally an East Anglian dialect word.
The use of splines for modeling automobile bodies seems to have several independent beginnings. Credit is claimed on behalf of de Casteljau at Citroen, Pierre Bezier at Renault, and Birkhoff, Garabedian, and de Boor at General Motors (see Birkhoff and de Boor, 1965), all for work occurring in the very early 1960s or late 1950s. At least one of de Casteljau's papers was published, but not widely, in 1959. De Boor's work at GM resulted in a number of papers being published in the early 60's, including some of the fundamental work on B-splines.
Work was also being done at Pratt & Whitney Aircraft, where two of the authors of (Ahlberg et al., 1967) — the first book-length treatment of splines — were employed, and the David Taylor Model Basin, by Feodor Theilheimer. The work at GM is detailed nicely in (Birkhoff, 1990) and (Young, 1997). Davis (1997) summarizes some of this material.
program spline_main
implicit none
integer max_tabu, ngrids_max, n_tabu, i, choice
integer more_points, ngrids
parameter (max_tabu = 100, ngrids_max = 2000)
real xa(max_tabu), ya(max_tabu), y2a(max_tabu), x, y, delta_x
real x_plot(ngrids_max), y_plot(ngrids_max), yp1, ypn
real x_min, x_max
character*40 filename1
c Ask filename and the number of tabulated points in the file.
write(*,*) 'Type in the file name of tabulated values (x,y)'
read (*,*) filename1
write(*,*) 'How many points are there in the tabulated set ?'
read (*,*) n_tabu
if (n_tabu.gt.max_tabu) stop 'Too many tabulated values,
& please recompile the main program with a larger max_tabu.'
c Open the file and read in the tabulated values, and write to screen
c for double check.
open (unit = 20, file = filename1)
do i = 1, n_tabu
read (20,*) xa(i), ya(i)
write(*,*) xa(i), ya(i)
end do
close (20)
c Ask slopes at two ends. (If > 10E30 then natural spline is set.)
write(*,*) 'Please type in slopes at bothend (> 10E30 -> y2a=0).'
read (*,*) yp1, ypn
c Call subroutine spline to solve for y2a array.
call spline(xa, ya, n_tabu, yp1, ypn, y2a)
c One can choose to type in x one by one or to generte a continuous set
c for graph plotting.
write(*,*) 'What do you want to do ?'
write(*,*)'0:input x, find y ; 1:generate a set of points (x,y)'
read (*,*) choice
c This part get x one by one.
if (choice.eq.0) then
1002 write(*,*) 'Type in your x:'
read(*,*) x
call splint(xa, ya, y2a, n_tabu, x, y)
write(*,*) 'Interpolated value is ', y
write(*,*) 'One more point (yes=1;no=0) ?'
read (*,*) more_points
if (more_points.eq.1) goto 1002
endif
c This part generate a set of x.
c The resulting (x,y) is written out into a file named by user.
if (choice.eq.1) then
write(*,*) 'Type your range x_initial and x-final:'
read (*,*) x_min, x_max
write(*,*) 'How many points do you want to plot ?'
read (*,*) ngrids
if (ngrids.le.1) stop 'Need at least two grids.'
delta_x = ( x_max - x_min ) / (ngrids - 1)
do i=1, ngrids
x_plot(i) = x_min + (i-1)*delta_x
call splint(xa,ya,y2a,n_tabu,x_plot(i),y_plot(i))
end do
write(*,*) 'Plrease give a name to your output file:'
read (*,*) filename1
open (unit=30, file=filename1)
do i=1,ngrids
write(30,*) x_plot(i), y_plot(i)
end do
close(30)
end if
end